On many maps shared by environmental agencies, research groups, and even newsrooms, small red or orange dots often appear over forests, grasslands, or agricultural regions. These dots are commonly called “hotspots.” Behind them is a global satellite system, operated with support from NASA, that detects unusual heat on the Earth’s surface—what scientists refer to as “thermal anomalies.”
For countries like Cambodia, where forests, farms, and protected areas cover large parts of the landscape, these maps have become an important tool. They are used to monitor fires, track land-use changes, and support early warning systems during the dry season. But what do these “thermal anomalies” actually mean, and how does NASA’s hotspot mapping work in practice?
Seeing Heat from Space
NASA does not look for flames directly. Instead, its satellites observe the Earth in different wavelengths of light, including infrared, which is closely related to heat. When a satellite passes over a region, it measures the temperature of the land surface pixel by pixel.
Under normal conditions, each type of surface—forest, water, soil, or city—has a typical temperature range for a given time of day and season. A “thermal anomaly” is detected when a specific area appears significantly hotter than what would normally be expected for that location and moment.
In simple terms, the system is not saying, “There is definitely a fire here.” It is saying, “This spot is much hotter than its surroundings, and that difference is unusual enough to be flagged.”
The Satellites Behind the Maps
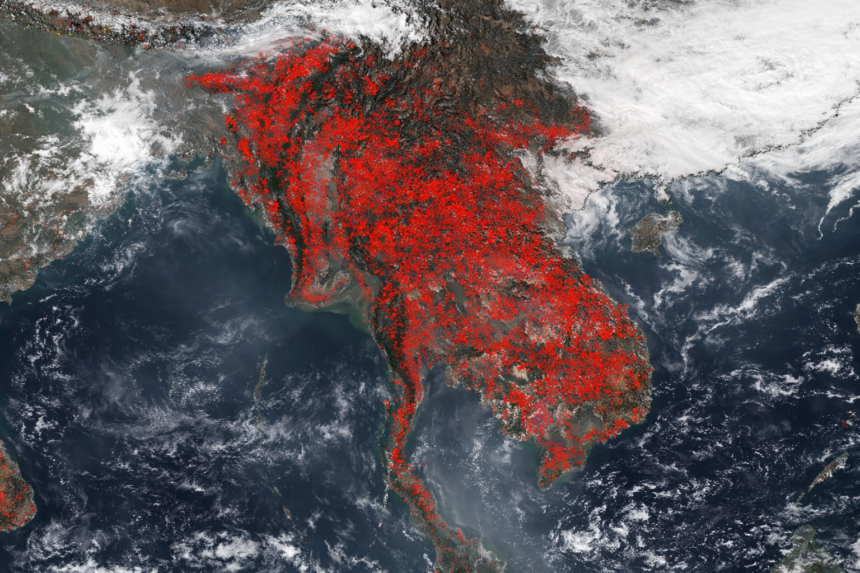
Several satellite instruments contribute to hotspot mapping, including sensors on NASA’s Terra and Aqua satellites and more recent Earth-observing platforms. One of the best-known systems is MODIS (Moderate Resolution Imaging Spectroradiometer), which scans the entire planet regularly and provides data used by scientists, governments, and international organisations.
These satellites orbit the Earth multiple times a day, allowing them to build a near-continuous picture of surface conditions. This frequent coverage is especially useful in regions like Southeast Asia, where weather, cloud cover, and seasonal changes can rapidly alter what is happening on the ground.
When the system detects a thermal anomaly, it records the location, time, and intensity of the heat signal. This information is then processed and displayed on maps that are publicly available.
What Causes a Thermal Anomaly?
In many cases, thermal anomalies are linked to fires. These can include:
- Forest or grassland fires
- Agricultural burning after harvest
- Peatland or brush fires
- Industrial heat sources in some locations
However, not every hotspot is a wildfire. Some thermal anomalies can come from factories, power plants, or even natural features that retain heat differently from their surroundings. This is why hotspot maps are best understood as indicators, not final confirmations.
For Cambodia, where controlled agricultural burning is still practiced in some areas and where forest protection is a national priority, this distinction matters. A hotspot may point to routine land management—or it may signal an unintended fire that needs attention.
From Data to Decision-Making
The real value of NASA’s hotspot mapping lies in how the information is used. Governments, environmental organisations, and researchers combine hotspot data with other sources, such as weather conditions, land-use maps, and field reports.
In practical terms, this helps to:
- Identify areas at risk during the dry season
- Support early response to potential fires
- Monitor protected forests and conservation zones
- Track long-term patterns in land use and climate impact
In Cambodia, where large forest landscapes still play a crucial role in biodiversity, water systems, and rural livelihoods, these tools support both conservation and planning. They do not replace ground patrols or local knowledge, but they add a wider, faster view of what may be happening across remote or hard-to-reach areas.
Why “Anomaly” Is the Key Word
The term “thermal anomaly” is carefully chosen. It does not claim certainty. It simply highlights a temperature reading that does not match the expected pattern.
This is important for understanding how to read hotspot maps. A cluster of anomalies over several days in the same area is more likely to indicate a sustained fire or repeated burning. A single, brief anomaly may turn out to be something temporary or non-hazardous.
For journalists, policymakers, and the public, this means hotspot maps should be seen as early signals, not final verdicts. They point to where attention may be needed, not to a complete explanation of what is happening on the ground.
The Cambodian Context: Forests, Farms, and Seasons
Cambodia’s climate follows clear wet and dry seasons, and this rhythm strongly influences how land is used. During the dry months, the risk of fire increases, especially in forest edges, grasslands, and agricultural areas.
Hotspot data becomes particularly relevant during these periods. It helps authorities and environmental groups focus resources, identify unusual patterns, and compare current conditions with previous years.
Over time, this historical data also allows researchers to study trends: Are certain regions seeing more frequent anomalies? Are fire seasons starting earlier or lasting longer? Are conservation efforts reducing hotspots in protected areas?
These questions are not only scientific. They are linked to agriculture, public health, tourism, and long-term environmental stability.
What Hotspot Maps Cannot Do
It is equally important to understand the limits of the system. Satellite sensors can be affected by cloud cover, smoke, or terrain. They also work at a certain resolution, meaning very small or short-lived fires might not always be detected.
Moreover, a hotspot does not describe the cause, scale, or impact of a heat source. Field verification is still essential to understand whether an anomaly represents a serious fire, controlled burning, or another heat-related activity.
In this sense, NASA’s hotspot mapping is best seen as a monitoring and awareness tool, not a replacement for local observation or response systems.
Why This Technology Matters in a Changing Climate
As climate patterns shift, many regions are experiencing longer dry seasons, higher temperatures, and more unpredictable weather. These conditions increase the importance of early detection and large-scale monitoring.
For Cambodia and its neighbours, satellite-based hotspot data supports regional cooperation, disaster preparedness, and environmental planning. It also helps connect local events—such as a forest fire in one province—to wider regional and global climate discussions.
From space, every country is part of the same system. The same satellites that monitor forests in the Cardamom Mountains also observe grasslands in Australia and peatlands in South America. This shared data creates a common reference point for understanding how the planet’s surface is changing.
Reading the Map with Care
When a hotspot map shows clusters of red or orange points, it can be visually striking. But the real meaning lies in how that information is interpreted, verified, and acted upon.
For Cambodia, these maps are not just images—they are tools that support forest protection, agricultural planning, and environmental awareness. They help turn distant satellite measurements into practical, ground-level decisions.
NASA’s hotspot mapping does not simply show fires. It shows thermal anomalies—places where heat behaves differently than expected. Behind each point is a complex system of satellites, sensors, and data analysis working to give the world a clearer, faster picture of what is happening on the Earth’s surface.
For Cambodia, this technology offers a way to watch over forests, farms, and remote landscapes from above, supporting both conservation and development in a time when understanding heat, climate, and land use has never been more important.
Also Read: Kep to Koh Rong: From Quiet Shores to Island Vibes